Skip to content
Riverside Sports Therapy
Sports Therapy Clinic For The Weekend Warrior
Menu
Home
Services
Shockwave Therapy
Chiropractic
Laser Therapy
Medical Acupuncture
Physiotherapy
Active Release Therapy
Athletic Therapy
RockTape Treatments
Graston
Custom Orthotics
RAPID NeuroFascial Reset
Massage Therapy
Fascial Stretch Therapy
Vestibular Rehabilitation Therapy
Aquatic Hydrotherapy Physiotherapy
Our Team
Calgary Team
Cochrane Team
About Us
Employment Opportunities
Testimonials
Contact Us
Calgary Location
NEW! Cochrane Location
Book Online Cochrane
Book Online Calgary
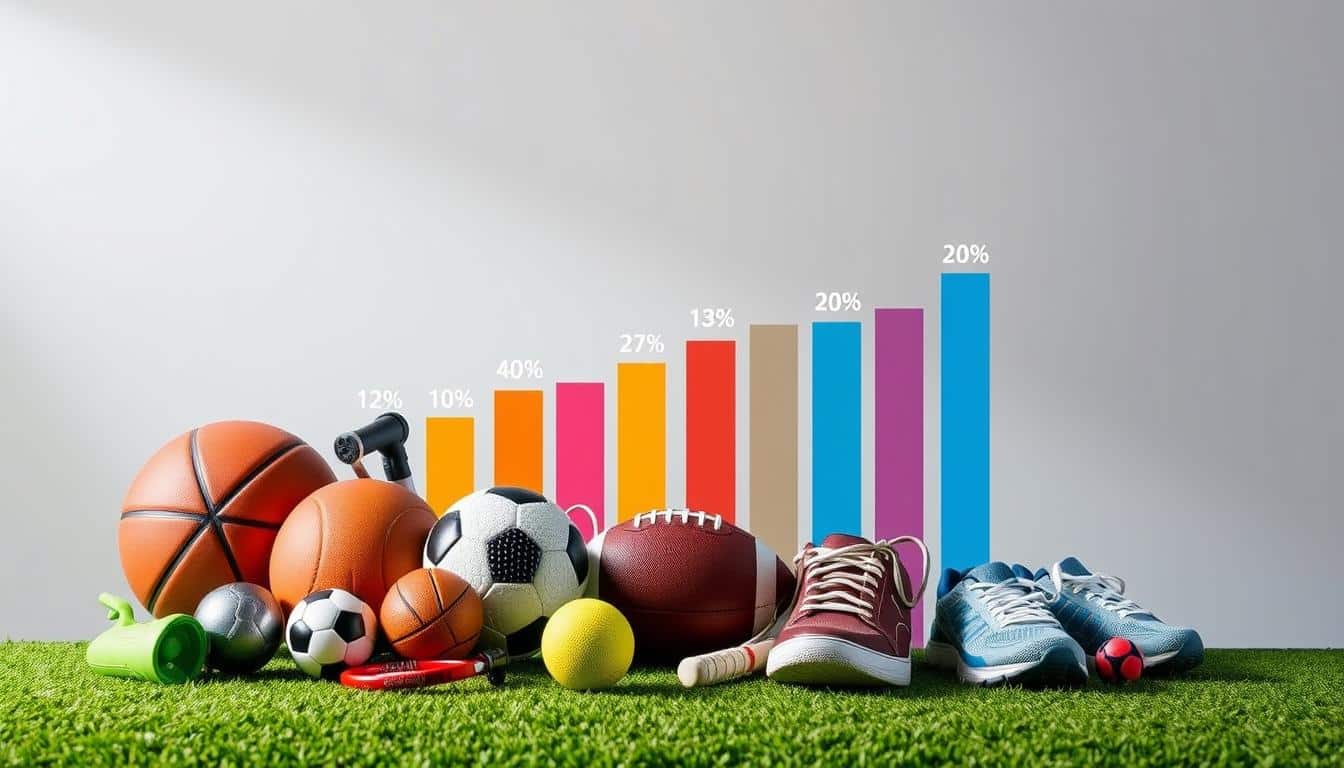
A-detailed-infographic-showcasing-the-comparative-injury-rates-across-various-sports
A-detailed-infographic-showcasing-the-comparative-injury-rates-across-various-sports
← Previous
Next →